
For Immediate Service
800-864-7717
For Immediate Service
800-864-7717Dec
23
2020
Dear Partners,
The brutal facts cannot be ignored. TD averaged over 3 new positive cases in our workforce each day for the last 7 days. It peaked even higher exactly 2 weeks after Thanksgiving. Near that point we had almost 6% of our workforce in quarantine for exposure or a positive test. That is declining now. We can also be thankful that our case tracing still finds no exposures in the workplace due to our safety protocols.
Please keep your holiday gatherings small-----be cautious and stay safe, so we can all be together for many years to come. This is hard but we can do it. #TDSTRONG
Sincerely,
Harold
P.S. More difficult USA statistics from the New York Times are below to bolster your resolve and perseverance for distancing and masks for several more months.
A Tragic Finish to the Year
Let’s check in on the latest coronavirus data, with help from three charts.
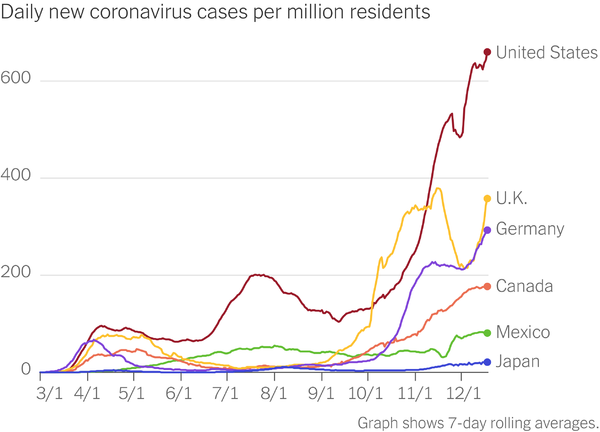
The first chart seen below shows that the situation in Europe has worsened over the past week — but not nearly to the level of the U.S.:

Controlling a pandemic during the fall and the winter is simply more difficult than during warmer months, when people can comfortably spend time outdoors. Experts long predicted that the later months of the year would be difficult in much of the world, and those predictions proved to be correct.
In Europe, several big countries have gone through cycles of having more and less success controlling this virus: Cases rise, and countries respond with new restrictions that bring down caseloads — until they lift the restrictions, become careless and then watch cases rise again. That has happened lately in Britain, Germany and elsewhere, and they have responded by announcing new restrictions.
The U.S. went through similar cycles in the spring and the summer. But since September, this country has failed to make another concerted effort to reduce infections. It’s worth emphasizing that the current U.S. problems were not inevitable. Just look at the lines in the chart above for Mexico and especially Canada, which has to cope with even colder weather.
The second chart seen below shows that the recent U.S. trends reflect a real increase in virus cases. It’s not a statistical mirage in which more widespread testing leads to a greater number of official cases. We know that because the share of tests that come back positive has surged:

The final chart below may be the most alarming.
Deaths in the U.S. are almost certain to rise in the coming weeks — probably to more than 3,000 a day, which would be by far the highest level yet.

The basic idea is that if you track the number of new virus cases, you can fairly accurately predict the number of Covid-related deaths about three weeks later. Every 100 new cases in the U.S. has led to an average of roughly 1.6 deaths, with a 22-day lag. (Trevor Bedford, a scientist at the Fred Hutchinson Cancer Research Center in Seattle).
The chart here suggests that the surge in cases during the first three weeks of December will lead to a surge in deaths during late December and early January.
All of this points to the same conclusion. As encouraging as the vaccine news is, most Americans will not be vaccinated for at least another several months, leaving plenty of time for the virus to do damage. And absent a rapid change in the country’s approach, tens of thousands of more Americans will needlessly die.
Some perspective - By the end of March, one analysis suggests that the vaccines will have saved 25,000 lives in the U.S.
More frequent usage of masks could save 56,000 lives.
Categories: From the CEO

TDIndustries is a premier facilities services and mechanical construction company. Founded in 1946, we are well-positioned to exceed customers’ expectations on any project regardless of size, complexity, within budget and on time.